Logs vs Monitoring
Once an application is live, there are at least two very different ways to “look at” it.
One is through logs.
The other is through monitoring-style signals.
Both matter. They are not the same thing. And mixing them up leads to a lot of confused debugging.
Two Different Questions
Section titled “Two Different Questions”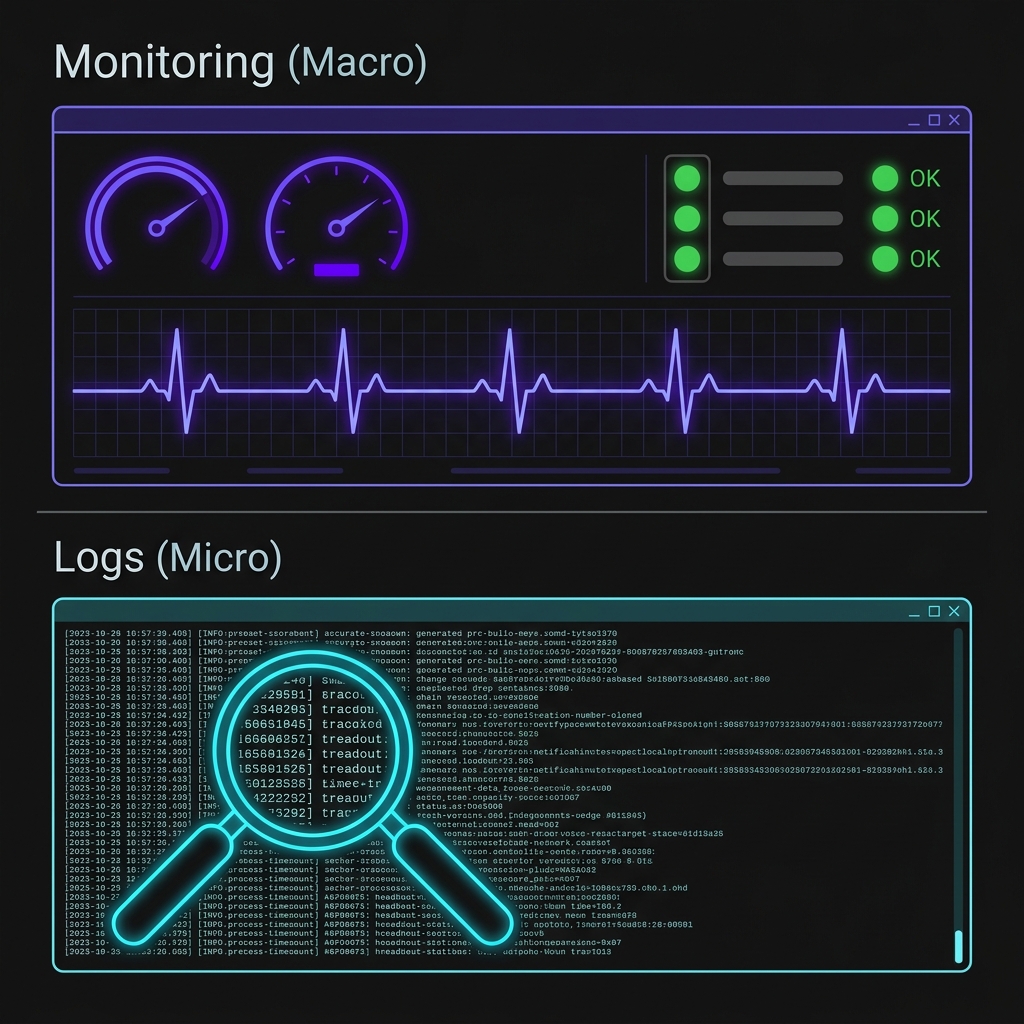
Fig 1. Monitoring reveals the high-level health of the system; Logs provide the low-level evidence.
A useful way to separate them is this:
Logs ask:
Section titled “Logs ask:”What happened?
Monitoring asks:
Section titled “Monitoring asks:”How is the system doing right now?
That distinction is the heart of the page.
Logs give us event-level evidence. Monitoring gives us higher-level health awareness.
Both are forms of visibility. They just operate at different altitudes.
Logs: The Story of Specific Events
Section titled “Logs: The Story of Specific Events”Logs are records of discrete things that happened.
Examples:
- the app started
- a request hit
/api/voyages - a database write failed
- an authentication check threw an error
Logs are great for answering questions like:
- what route was hit?
- when did the failure happen?
- what was the error message?
- what was the app trying to do at the time?
That makes logs especially good for debugging specific problems.
They are detailed. They are textual. They are often messy in a very informative way.
Logs are the closest thing we get to a written trail of the application’s behavior. They help us reconstruct what happened after the fact, especially when something fails in a way the user cannot explain clearly.
Why Logs Alone Are Not Enough
Section titled “Why Logs Alone Are Not Enough”Logs are useful, but they are not always the fastest way to understand the overall state of a live system.
If you stare at a busy stream of text, you might be able to answer:
- “what just happened on this route?”
- “what error occurred here?”
But it is much harder to answer:
- “is the system healthy overall?”
- “is error volume rising?”
- “is memory usage climbing over time?”
- “did something suddenly get slower?”
That is not really what logs are built for.
Logs are excellent for detail, but terrible at summarizing the big picture quickly. Reading a stream of text to understand overall system health is like trying to judge traffic conditions by reading individual license plates.
Monitoring: The Shape of System Health
Section titled “Monitoring: The Shape of System Health”Monitoring is a broader lens.
Instead of preserving every event as text, monitoring systems tend to aggregate signals into a more readable form.
Examples include:
- CPU usage
- memory consumption
- request volume
- error rate
- response time
- uptime checks
These are not trying to tell the full story of every request.
They are trying to answer questions like:
- is the system under strain?
- is it behaving normally?
- is something drifting in a bad direction?
- did a major change just make things worse?
That makes monitoring especially useful for situational awareness.
What Monitoring Is Good At
Section titled “What Monitoring Is Good At”Monitoring shines when you need to quickly answer:
- is the service up?
- is performance degrading?
- are errors spiking?
- is memory usage climbing in a suspicious way?
- did the system change behavior after a deploy?
Those are not log-style questions. They are health-style questions.
And that difference matters.
A graph showing memory steadily rising over time is often far more useful in that moment than 10,000 lines of request output.
The Relationship Between Them
Section titled “The Relationship Between Them”The healthiest way to think about this is:
Monitoring tells us that something is wrong.
Section titled “Monitoring tells us that something is wrong.”Logs help us figure out why it is wrong.
Section titled “Logs help us figure out why it is wrong.”That pairing is incredibly important.
For example:
- monitoring says error rate spiked in the last 10 minutes
- logs show repeated database timeouts on a specific route
Or:
- monitoring shows memory usage climbing steadily
- logs reveal a pattern of a specific request path or repeated failure behavior
That is the handshake.
Monitoring gives us the wide-angle view. Logs give us the close-up evidence. One tells us where to look. The other helps explain what we find.
Where Voyagers Log Fits Right Now
Section titled “Where Voyagers Log Fits Right Now”In this lesson, we are still working at the early stages of production awareness.
That means we are not building a full monitoring stack with dashboards, alerting rules, percentile charts, and incident escalation flows.
What we are doing is building the first operational habits that lead in that direction.
So for Voyagers Log, our visibility stack at this stage looks more like:
- startup logs
- request logs
- error logs
- a few tiny health-style signals
That is intentionally small.
We are learning the distinction before we go trying to build the whole observability universe.
Why This Distinction Matters
Section titled “Why This Distinction Matters”If we do not explicitly separate logs from monitoring, a few bad habits tend to show up fast.
We start expecting logs to do everything. We start treating random platform graphs like detailed diagnostic evidence. We lose track of whether we need:
- a specific event trail or
- a broad health signal
That confusion slows everything down.
This page exists to make the split explicit:
- logs are event evidence
- monitoring is health awareness
Once that clicks, later operational tools make much more sense.
The Bridge to the Next Step
Section titled “The Bridge to the Next Step”Now that we understand this distinction, we can add more intentional operational signals to the app.
Not giant enterprise monitoring. Just small, focused signals that help answer quick health-style questions.
You may have noticed that we actually already included a small /api/health endpoint in Voyagers Log.
It is not a full enterprise monitoring system. But it is a very practical, concrete first monitoring-style signal.
Now that we understand the difference between logging and monitoring, it is time to take a closer look at that endpoint, improve it, and figure out how we actually use it in the wild.
Extra Bits & Bytes
Section titled “Extra Bits & Bytes”Google SRE Book: Monitoring Distributed Systems
⏭ The Heartbeat Endpoint
Section titled “⏭ The Heartbeat Endpoint”Logs help us understand what happened. Next, we revisit the /api/health route we already put in place, upgrade its signals, and learn how to actually hit it.